Co-founder of AURUM, specializing in growth marketing and development.
Quick Takeaways
The average OnlyFans creator earns $131 per month. The top 1% average over $49K. The difference isn't just better content — it's better data. Most creators I work with check one thing: their monthly revenue. Maybe their subscriber count. That's it. They're making promotion decisions, pricing changes, and content choices based on gut feeling. And when revenue dips, they panic and throw out what was...
What OnlyFans Actually Shows You (And Why It's Not Enough)
OnlyFans gives you a statistics page with the basics: subscriber count, monthly earnings, likes on posts, and a percentage ranking. You also get payout statements. That's about it.
OnlyFans does offer tracking links for different platforms. But creators report they only capture a fraction of actual subscribers. Don't rely on them as your only attribution method.
Fan Lifetime Value - The Metric Nobody Talks About
This is the first number I check when reviewing a creator's account. Not monthly revenue. Not subscriber count. Fan lifetime value - how much the average fan is worth across their entire time on your page. Why does LTV matter more than revenue? A $5 increase in LTV across 500 fans creates $2,500 in extra revenue - without getting a single new subscriber. Most creators obsess over getting more fans...
“I've never seen anybody talk about LTV regarding OnlyFans. It's totally overlooked.”
| Component | Formula | Example |
|---|---|---|
| Monthly ARPU | Total revenue / Active fans | $25,000 / 500 = $50 |
| Average fan lifespan | 1 / Monthly churn rate | 1 / 0.40 = 2.5 months |
| Lifetime Value | ARPU x Average lifespan | $50 x 2.5 = $125 |
LTV calculation formula with worked example
Average OnlyFans creator monthly earnings
Example LTV from a creator earning $25K/month with 504 fans
Reddit creator data (motherspicymoney, r/onlyfansadvice)
OnlyFans platform average from ofstats.net
Chatting-to-Subscription Ratio
Here's the metric that separates $3K/month creators from $30K/month creators: how much of your revenue comes from DM conversations versus subscriptions alone. When I onboard a new creator, I see the same pattern every time. They're fixated on subscription price - $5 or $10 or $15? But subscription revenue is the smallest slice of the pie for high earners. Across every account we manage at AURUM, chat...
Underpricing is the most common mistake I see during onboarding. Creators set low PPV prices because they're afraid fans will leave. The data shows the opposite - fans who buy custom content renew at 81%, versus 38% for those who never purchase.
| Revenue Source | Low Earners (under $3K/mo) | High Earners ($10K+/mo) |
|---|---|---|
| Subscriptions | 60-80% | 10-20% |
| Messages and Tips | 10-20% | 30-40% |
| PPV | 5-10% | 25-35% |
| Customs | 0-5% | 10-20% |
Revenue distribution by earnings tier (AURUM data, 2026)
Churn Rate - How Fast You're Leaking Fans
Your churn rate is the percentage of subscribers who leave each month. Formula: (Subscribers lost / Subscribers at start of month) x 100. The brutal reality: about half your subscribers at any given time are brand new. One verified creator shared that over 3 years, she had 5,800 unique accounts subscribe - but only averaged 500 to 1,000 active at once. Most were one-and-done. If your churn rate is...
30-40% monthly churn
Healthy for OnlyFans. Your retention is working. Keep doing what you're doing.
40-50% monthly churn
Industry average. Room to improve, but not an emergency. Focus on DM response speed and posting consistency.
50%+ monthly churn
Red flag. You're spending more energy replacing fans than growing. Stop promoting and fix retention first.
OnlyFans doesn't show churn directly. Track your subscriber count at the same time each day in a Google Sheet. After 30 days, you'll have the data to calculate your actual churn rate.
| Churn Cause | Impact | Fix |
|---|---|---|
| Slow DM responses | 35% of churn | Respond within 2-3 minutes during active hours |
| Inconsistent posting | 28% of churn | Post daily or set a visible schedule |
| Repetitive content | 18% of churn | Rotate content types weekly |
| PPV spam | 12% of churn | Cap PPV to 2-3 per week max |
| Other factors | 7% of churn | Survey departing fans when possible |
Get weekly growth strategies
Reddit tactics, Instagram breakdowns, and funnel tips — free on Telegram.
PPV Unlock Rate - Your Best Signal for Content Quality
Your PPV unlock rate is the percentage of fans who open and pay for a PPV message. It's your single best indicator of content quality and pricing accuracy. Formula: (Number of unlocks / Number of PPV messages sent) x 100. Timing matters too. PPV performance spikes Friday 6pm through Sunday midnight. If you're sending your best content on a Tuesday morning, you're leaving money on the table. Read o...
25-35% unlock rate
Excellent. Your pricing and content match what fans want. Keep testing to push higher.
15-25% unlock rate
Average. Test lower prices or write better teaser captions. Try A/B testing two price points.
Under 15% unlock rate
Problem. You're either overpriced, your teasers aren't selling, or you're sending too many PPVs per week.
Track unlock rate per price tier - not just overall. A 30% unlock rate on $5 PPVs earns less than a 15% rate on $25 PPVs. Revenue per send is what matters.
Target PPV unlock rate for established creators
Renewal rate for fans who buy custom content
Renewal rate for fans who never purchase anything
Traffic Source ROI - Which Platform Brings Your Best Fans
Not all subscribers are equal. A fan from Reddit might spend $200 over 3 months. A fan from TikTok might subscribe at $5 for one month and disappear. Most creators track which platform brings the most clicks. Wrong metric. You need to track which platform brings the highest-spending, longest-staying fans. Tube sites like Pornhub convert at roughly 10% — low click volume but . Our breaks down platf...
Conversion rate alone is misleading. One top creator tracked her time per platform and found Twitter had better click-to-sub numbers - but after factoring in 3 hours/day for only 3 subs/day, Instagram was actually more efficient. She switched to IG and got 70 paid subs in 36 hours. The real metric: revenue per hour spent promoting.
| Platform | Click-to-Sub Rate | Notes |
|---|---|---|
| Pornhub | 10% | Highest intent but limited scale |
| 7% | Strong for paid pages and niche targeting | |
| Twitter/X | 6% | Good for NSFW audiences directly |
| 1.4% | Low conversion but massive reach |
Conversion rates from verified creator data
Content Performance Score - Which Post Types Actually Earn
Which types of content earn the most money per post? Break your content into categories - photos, videos, text posts, livestreams, PPV bundles - and track total revenue from each type over a month. Divide by number of posts in each category. You'll spot patterns fast. Maybe 2-minute video clips generate 4x the tips of photo sets. Maybe text-only posts with a strong story get more comments and keep...
Track per-post metrics for 30 days minimum
Log likes, comments, and tips for every post. Tag each one by content type so you can compare categories.
Calculate revenue per post for each category
Total revenue from a content type divided by number of posts. This shows what's actually earning - not just what gets likes.
Double down on your top 2-3 types
Stop guessing what to post. Let the data decide. Post more of what your specific audience responds to.
Test one new format per month
Keep 80% of your content in proven categories. Use the other 20% to experiment with new formats.
Revenue per post is a lagging indicator. Likes and comments happen right away. If a post gets 2x your normal engagement but no tips immediately, watch the next 48 hours - engaged fans often convert to PPV buyers later that week.
Get weekly growth strategies
Reddit tactics, Instagram breakdowns, and funnel tips — free on Telegram.
Net Subscriber Growth - The Number That Tells the Truth
Your subscriber count going up doesn't always mean you're growing. If you gained 200 new subs but lost 180, your net growth is only 20. That's a treadmill, not a growth curve. Net subscriber growth = New subscribers minus churned subscribers. Positive net growth month over month means your acquisition outpaces churn. Flat or negative net growth - even while your total count looks stable - means yo...
If your net growth has been flat for 3+ months, stop adding new promo channels. Fix retention first. Most revenue plateaus aren't a promotion problem - they're a churn problem.
Of active subscribers at any time are brand new
Of subscribers lost when raising prices significantly
OnlyFans re-opt-in policy (creator reports)
Of fans purchase on day one then disappear
The 30-Minute Sunday Review
Tracking 7 fan metrics for your OnlyFans analytics sounds like a lot. It's not. Here's the exact weekly review I run for every creator we manage at AURUM.
Creators who review their numbers every Sunday catch problems before they become crises. Thirty minutes of data review saves weeks of guessing. If you're just starting out, our covers setting up your first tracking sheet.
Log your subscriber count
Open OnlyFans, write down your current number. Compare to last Sunday. Calculate net growth for the week.
Calculate this week's ARPU
This week's revenue divided by average subscriber count. Is it trending up or down compared to last week?
Check your chatting ratio
Look at your earnings breakdown - subscriptions vs messages, tips, and PPV. Is chatting revenue at 50%+ of total?
Review PPV performance
How many PPVs did you send? What was the unlock rate? Which price points converted best?
Check traffic sources
Which platform drove the most new subscribers? More importantly, which drove the highest-spending fans?
Score your content
Which posts got the most engagement and revenue this week? Plan next week's content around what worked.
Update your spreadsheet
Log all numbers. Look at the 4-week trend. One bad week is noise. Four bad weeks is a pattern that needs action.
Best OnlyFans Analytics Tools (Free and Paid)
You don't need expensive software to track these 7 metrics. Here's an honest breakdown of your options - from free OnlyFans analytics tools to full-featured paid platforms.
If you're earning under $3K/month, a Google Sheet and 30 minutes every Sunday gives you 80% of what a paid tool provides. Save your money for content equipment or promotion. Once you pass $5K/month, a tool like Supercreator or BuddyX starts making sense.
| Tool | Price | Best For | Key Features |
|---|---|---|---|
| Google Sheets (DIY) | Free | Beginners under $1K/mo | Full control, manual tracking, custom LTV calculators |
| BuddyX | ~$10-20/mo | Solo creators, vault tracking | Affordable, marks purchased content, lightweight |
| Supercreator | Sliding scale | Solo creators $1K+/mo | Mobile app, AI features, automations, analytics |
| Infloww | Varies | Agencies, multi-person teams | Team management, detailed reporting, technical |
| FansMetric | $39-99/mo | Multi-account management | CRM features, fan LTV tracking, KPI reports |
Mistakes to Avoid
Only checking monthly revenue
Revenue alone tells you nothing about what's working or broken. A $5K month could be healthy growth or a ticking time bomb if churn is running at 60%.
Ignoring chatting earnings
If subscriptions make up more than 30% of your income at scale, you're leaving the biggest revenue stream untouched. Top earners get 70-80%+ from messages, tips, PPV, and customs.
Treating all subscribers the same
Your top 10% of fans drive up to 80% of revenue. Identify your highest spenders and give them priority - they're the ones keeping your page profitable.
Tracking clicks instead of revenue per platform
A platform with high click counts but low-spending subscribers is a worse investment than one with fewer clicks but fans who actually tip and buy PPV.
Frequently Asked Questions
OnlyFans shows your total subscriber count, monthly earnings, likes on posts, a creator percentile ranking, and payout statements. You can also create tracking links for different platforms. But it doesn't show historical trends, churn rates, fan-level spending, or content performance breakdowns.
Log into your OnlyFans creator dashboard and click on the Statistics section. You'll see your current subscribers, earnings, and engagement. For deeper metrics like LTV, churn, and ARPU, you'll need to calculate them manually or use a third-party tool.
Anything under 40% monthly is solid. The industry average is 40-50%. If your churn is above 50%, focus on DM response time, posting consistency, and content variety before spending more on promotion.
Average Revenue Per User. Calculate it by dividing your total monthly revenue by your total active subscribers. If your ARPU is under $20, you're likely relying too heavily on subscription revenue and not monetizing through messages, tips, and PPV.
OnlyFans' built-in statistics page is free but limited. Beyond that, Google Sheets with manual daily tracking is the best free option. Linktree's free plan gives you click data but no detailed analytics. Most third-party tools like Supercreator and FansMetric require paid subscriptions.
Do a full review once per week - Sunday works well. Log your subscriber count daily (takes 30 seconds). Check PPV performance within 24-48 hours of sending. Don't check revenue hourly - that leads to reactive decisions instead of strategic ones.
The top causes are slow DM responses (35%), inconsistent posting (28%), repetitive content (18%), and excessive PPV messages (12%). Fans who buy custom content renew at 81%, while fans who never purchase anything renew at only 38%.
Summary
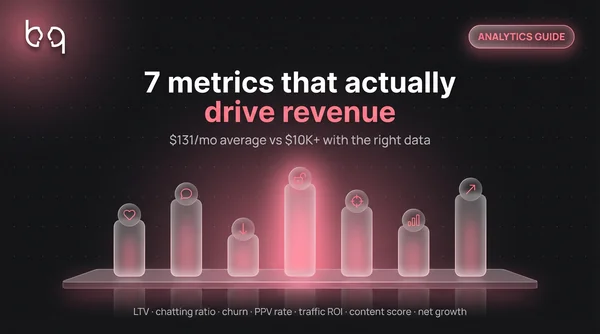
The gap between a $131/month creator and a $10K/month creator isn't talent or luck — it's knowing which numbers to watch. Track your LTV, chatting ratio, churn rate, PPV unlock rate, traffic source ROI, content performance, and net subscriber growth every week. Start with a free spreadsheet. Upgrade to a paid tool when the time savings justify the cost. Stop making decisions based on what feels ri...
Get weekly growth strategies
Reddit tactics, Instagram breakdowns, and funnel tips — free on Telegram.
Want Experts Tracking Your Growth Metrics?
AURUM's growth team monitors these KPIs daily for every creator we manage. Apply to get a dedicated analytics review.